The USMLE recently released the percentile rankings (PDF) for scores on all three board exams taken between 2017 through 2019 (updated May 19, 2022). The USMLE does not publish percentile rankings with individual scores and only provides this kind of data to the public every 1-2 years.
In the tables below we have kept the data from previous reports, but the graphs and analysis are updated to reflect the latest data.
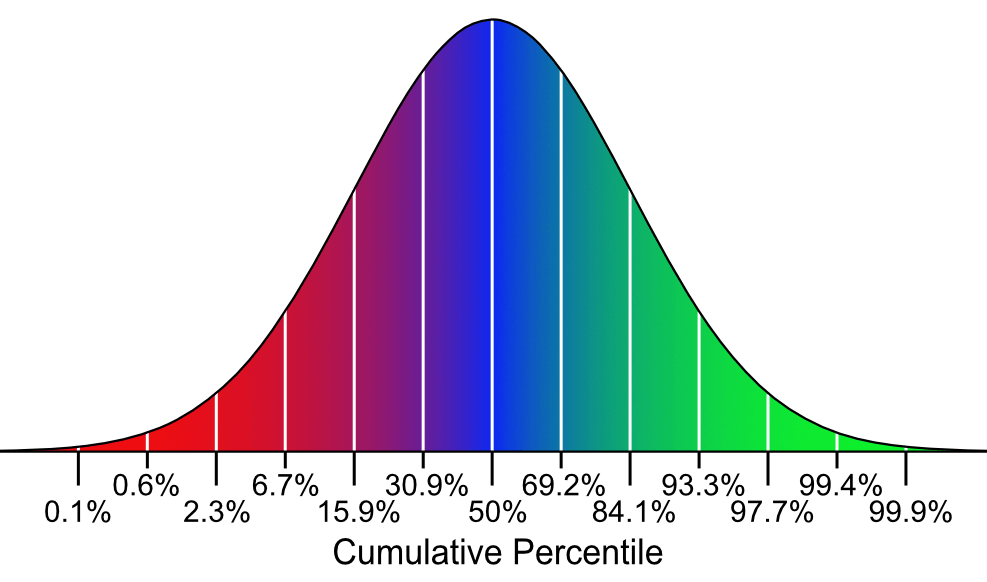
This information is very interesting because we can see the actual distribution of scores compared to a normalized distribution, or standard bell curve, that we typically assume when calculating a percentile rank for USMLE scores.
USMLE Step 1
Let us get right into the data. The following is the table showing the mean and standard deviation on USMLE Step 1 for US and Canadian students.
| USMLE Step 1 | ||
|---|---|---|
| Calendar Year | Mean | Standard Deviation |
| 2011 | 226 | 22 |
| 2012 | 227 | 22 |
| 2013 | 228 | 21 |
| 2014 | 229 | 20 |
| 2015 | 229 | 20 |
| 2016 | 228 | 21 |
| 2017 | 229 | 20 |
| 2018 | 230 | 19 |
| 2019 | 232 | 19 |
| 2020 | 235 | 18 |
| 2021 | 231 | 19 |
The are some questions that we will try to answer with this information:
- What is the actual distribution of scores? Is it close to a normalized distribution or is it skewed?
- What do the different distributions really tell us?
- How accurate is our percentile calculator?

